Service graphs
Graph Information
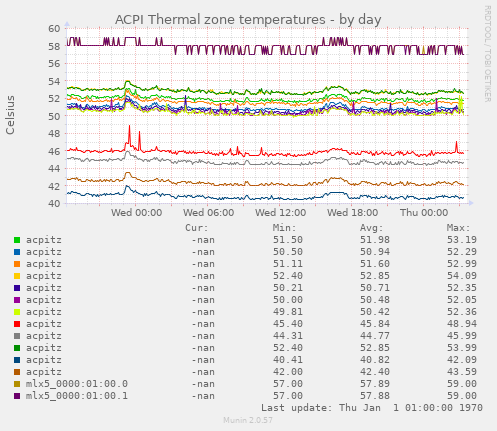
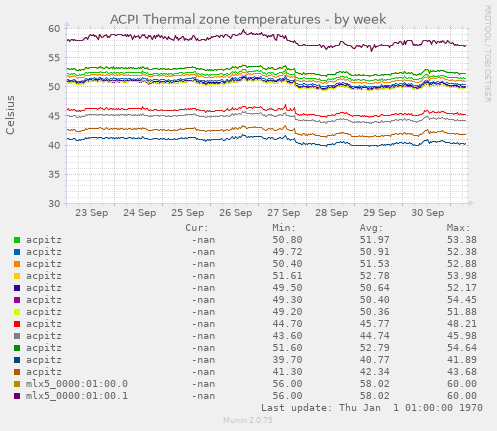
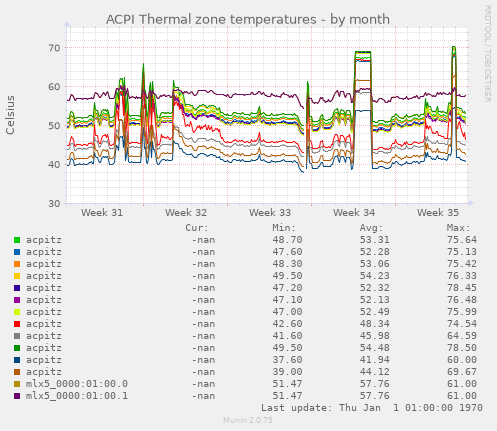
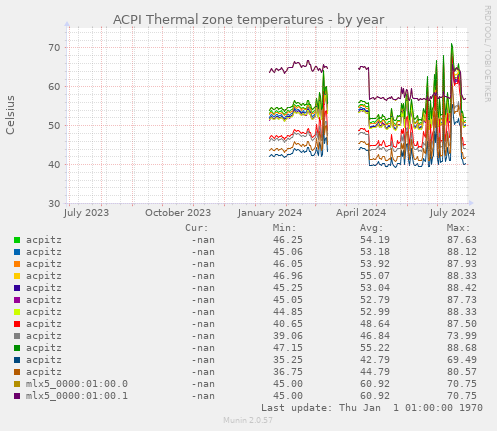
This graph shows the temperature in different ACPI Thermal zones. If there is only one it will usually be the case temperature.
| Field |
Internal name |
Type |
Warn |
Crit |
Info |
| acpitz |
thermal_zone0 |
gauge |
|
|
|
| acpitz |
thermal_zone1 |
gauge |
|
|
|
| acpitz |
thermal_zone2 |
gauge |
|
|
|
| acpitz |
thermal_zone3 |
gauge |
|
|
|
| acpitz |
thermal_zone4 |
gauge |
|
|
|
| acpitz |
thermal_zone5 |
gauge |
|
|
|
| acpitz |
thermal_zone6 |
gauge |
|
|
|
| acpitz |
thermal_zone7 |
gauge |
|
|
|
| acpitz |
thermal_zone8 |
gauge |
|
|
|
| acpitz |
thermal_zone9 |
gauge |
|
|
|
| acpitz |
thermal_zone10 |
gauge |
|
|
|
| acpitz |
thermal_zone11 |
gauge |
|
|
|
| acpitz |
thermal_zone12 |
gauge |
|
|
|